
Senate Kills Clarity Act, Bitcoin Slides to $75K Before Fed Decision
Regulatory Failure Triggers Immediate Selloff
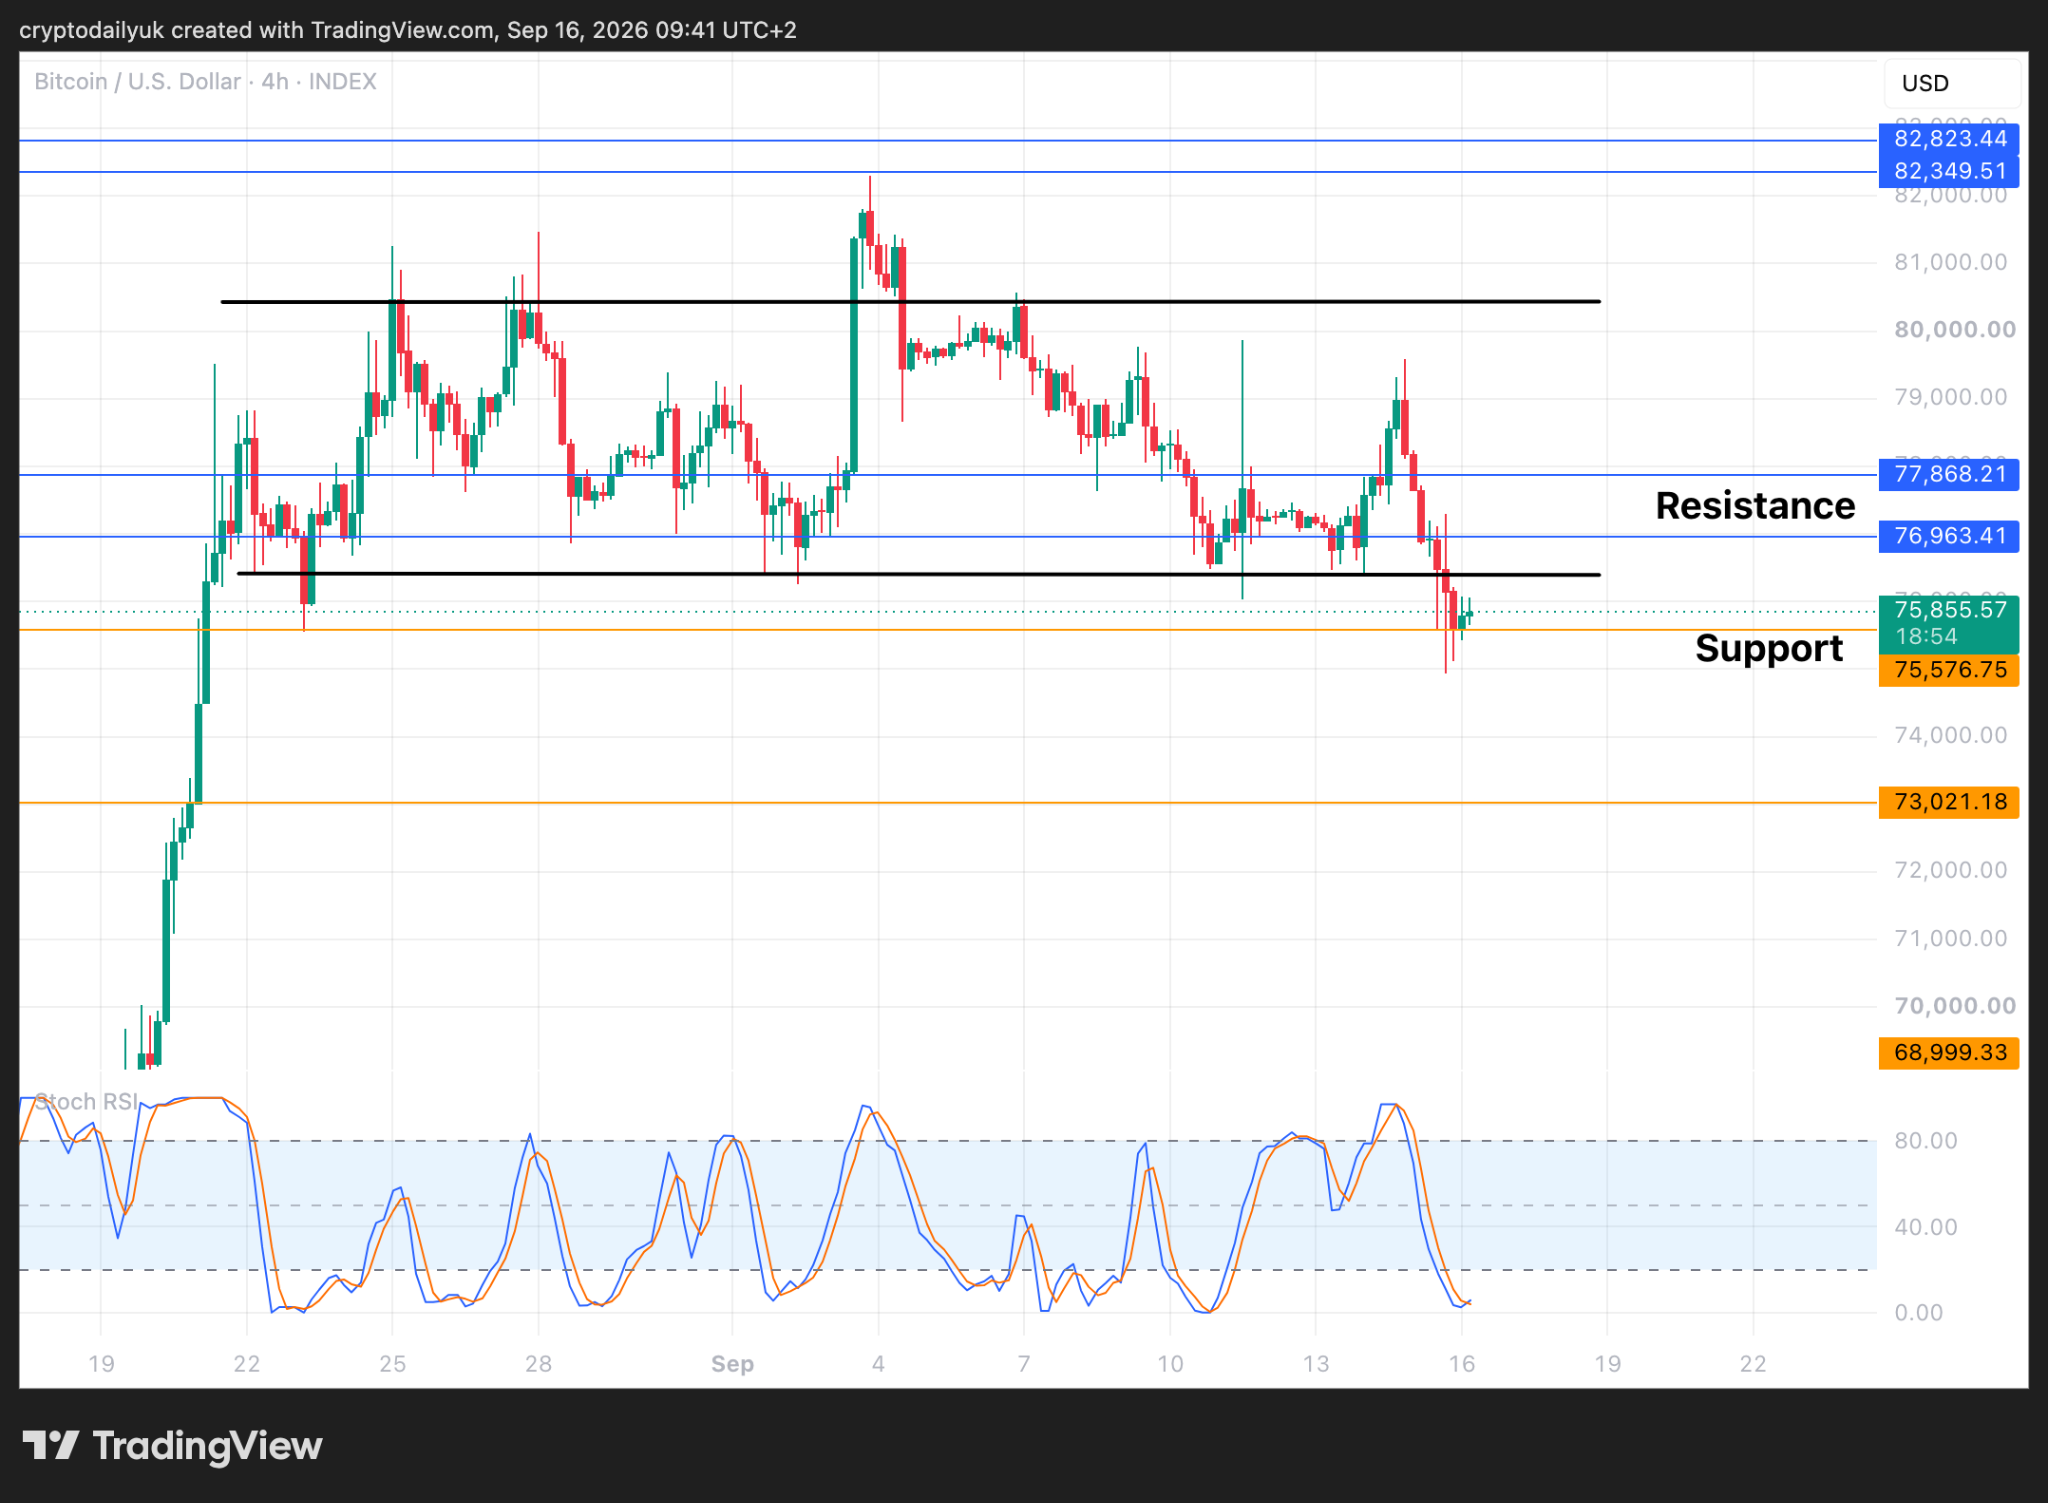
Bitcoin fell sharply to $75,000 on Tuesday after the U.S. Senate rejected the Clarity Act, stripping away a piece of crypto legislation that markets had been quietly pricing in as a stabilizing force. The drop was abrupt – BTC broke out of the parallel channel it had been trading within and touched $75,600 before staging a minor recovery. Whether that level holds through Wednesday’s Federal Reserve FOMC meeting is the immediate question every Bitcoin holder is watching.
The timing compounds the pressure. A 25 basis point interest rate hike is expected from the Fed later Wednesday, and while that move has likely already been absorbed into current prices, the official announcement introduces its own volatility window. Fed Chairman Warsh’s language around future rate direction could matter as much as the hike itself – markets will parse every word for signals about year-end monetary policy.

What the Charts Are Showing
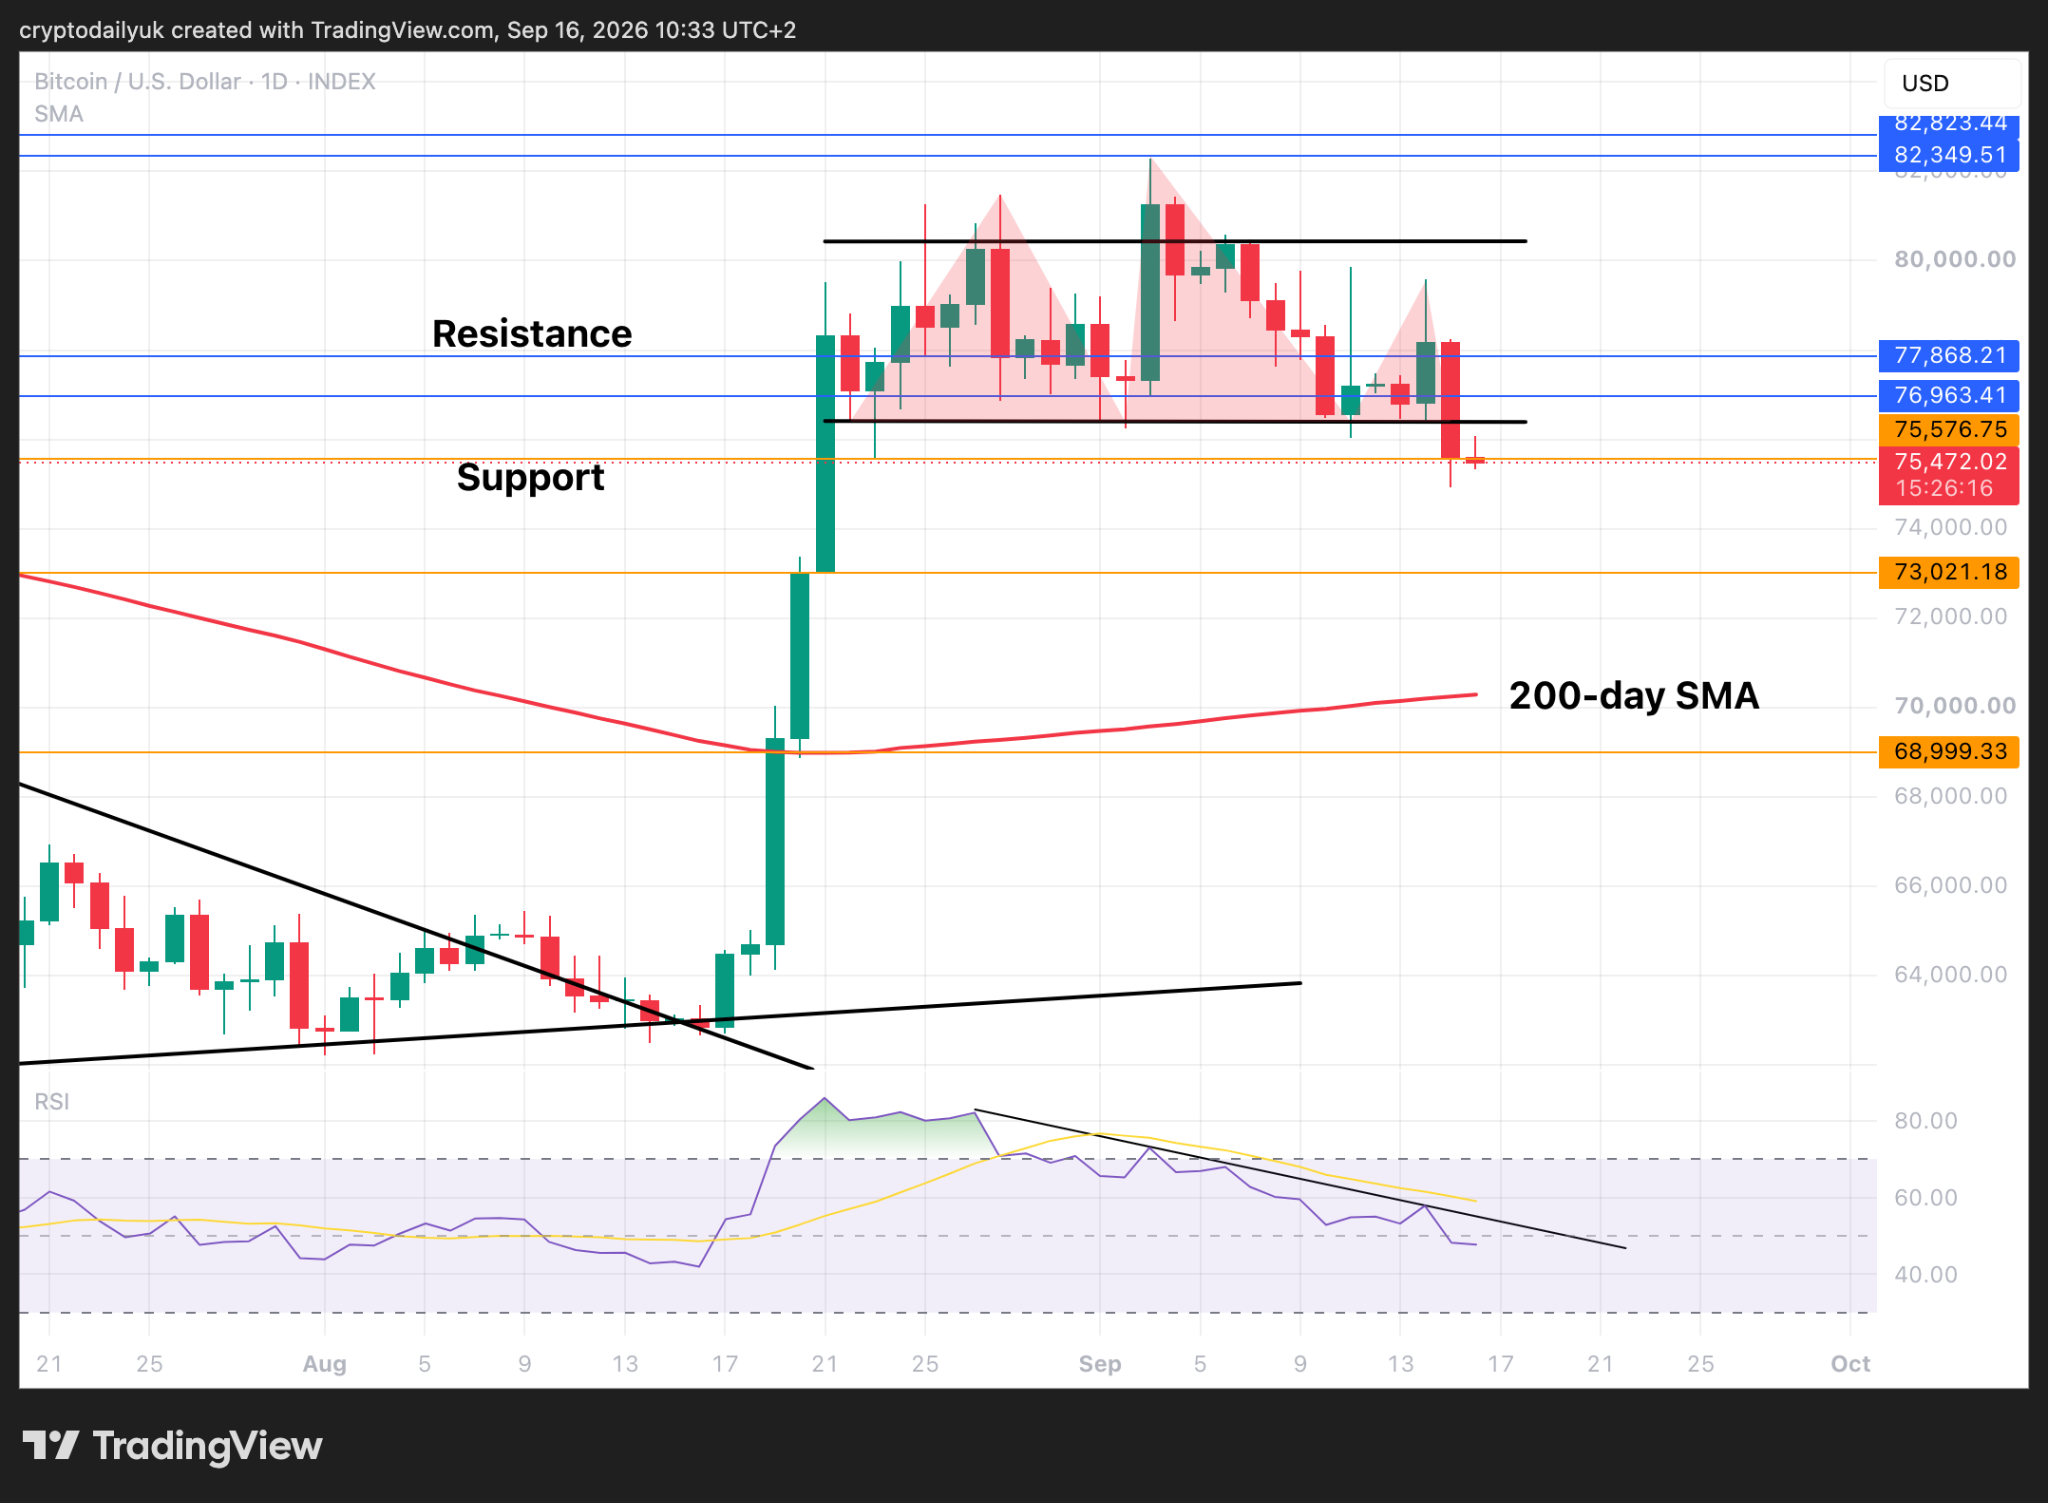
On the daily chart, Bitcoin is sitting at the edge of what technical analysts would consider a textbook deterioration setup. The $75,600 level, where price wicked down and briefly found footing, aligns with the start of the broken parallel channel – a former support zone that now faces the classic test of converting to resistance. The probability that price returns to retest the underside of that channel is reasonably high, given how frequently broken support structures attract retests before trend continuation in either direction.
That channel bottom also functions as the neckline of a head and shoulders pattern visible on the daily timeframe. A rejection at that neckline – which would confirm the pattern – points to an initial downside target near $73,000. That figure isn’t arbitrary: it corresponds to the 0.382 Fibonacci retracement level of the prior rally. Given the magnitude of Bitcoin’s previous upswing, this shallower retracement zone could attract buying interest from traders who missed the earlier move.
If $73,000 fails to hold, the measured move from the head and shoulders structure puts the next significant target at $70,500. That level carries notable technical weight – it sits near both the 200-day simple moving average and the 0.618 Fibonacci retracement taken from the base of the rally to its peak. Two major technical frameworks landing on the same price point tends to produce meaningful reactions, in one direction or another.
The Relative Strength Index on the daily chart adds another layer of concern. The RSI indicator line has been declining steadily and is now pressing against a descending trendline that has formed above it. For any sustained bullish price action to develop, that trendline needs to break to the upside. Until it does, momentum remains structurally weak regardless of short-term bounces driven by news flow around the FOMC announcement.
Weekly View and the Support Ladder Below
Zooming out to the weekly chart, the bias toward further downside looks more probable than a recovery in the near term. The current $75,600 support level is doing work, but it isn’t deep-rooted. If it gives way – and it could do so quickly depending on how the market interprets Wednesday’s Fed communication – a cascade lower becomes the more plausible scenario rather than a contained correction.
Below $73,000, the next major level that analysts have flagged sits at $69,000, considered a strong structural support zone. A more aggressive selloff, the kind driven by forced liquidations or a pronounced risk-off reaction to the Fed, could push price toward $65,700 – which, based on historical price behavior, may be the sturdiest floor in the current range. The distance between $75,600 and $65,700 represents a potential drawdown of roughly 13% from current levels, which would still leave Bitcoin well within the range it has occupied across multiple cycle corrections.
Two Events That Will Shape the Next Move
Wednesday’s session ends with two data points that will likely determine Bitcoin’s short-term path: the Fed’s rate decision and accompanying language, and the weekly close. The rate hike itself – 25 basis points – is not the variable; the Fed’s framing of what comes next is. If Warsh signals a pause or softening in the hiking cycle, risk assets including Bitcoin could find renewed footing. If the language leans hawkish, the $75,600 support comes under immediate threat again.
The weekly close carries its own significance separate from the intraday noise. A close below $75,600 on the weekly chart would structurally confirm the breakdown and give technical traders additional conviction to position short heading into the following week. A close above it, conversely, would leave the situation ambiguous and potentially force short-sellers to reconsider their positioning – creating exactly the kind of short squeeze that can produce sharp, disorienting rallies even in otherwise bearish environments.
The Clarity Act’s failure removes a regulatory framework that digital asset markets had treated as a potential catalyst for institutional re-engagement. Without it, the policy uncertainty that has kept some institutional allocators on the sidelines doesn’t resolve – it deepens. Bitcoin is now navigating a moment where both its technical structure and its regulatory backdrop are pointing in the same direction, and the only counterweight is whatever the Fed says in the next few hours. Whether $75,600 is the floor or merely a temporary resting point before the next leg down may depend entirely on a few sentences from Jerome Powell’s prepared remarks.
Comments are closed, but trackbacks and pingbacks are open.