
Bitcoin Slides to $76K as 10-Year Yield Cracks 19-Year Ceiling
Bond Market Pressure Reaches Bitcoin’s Doorstep
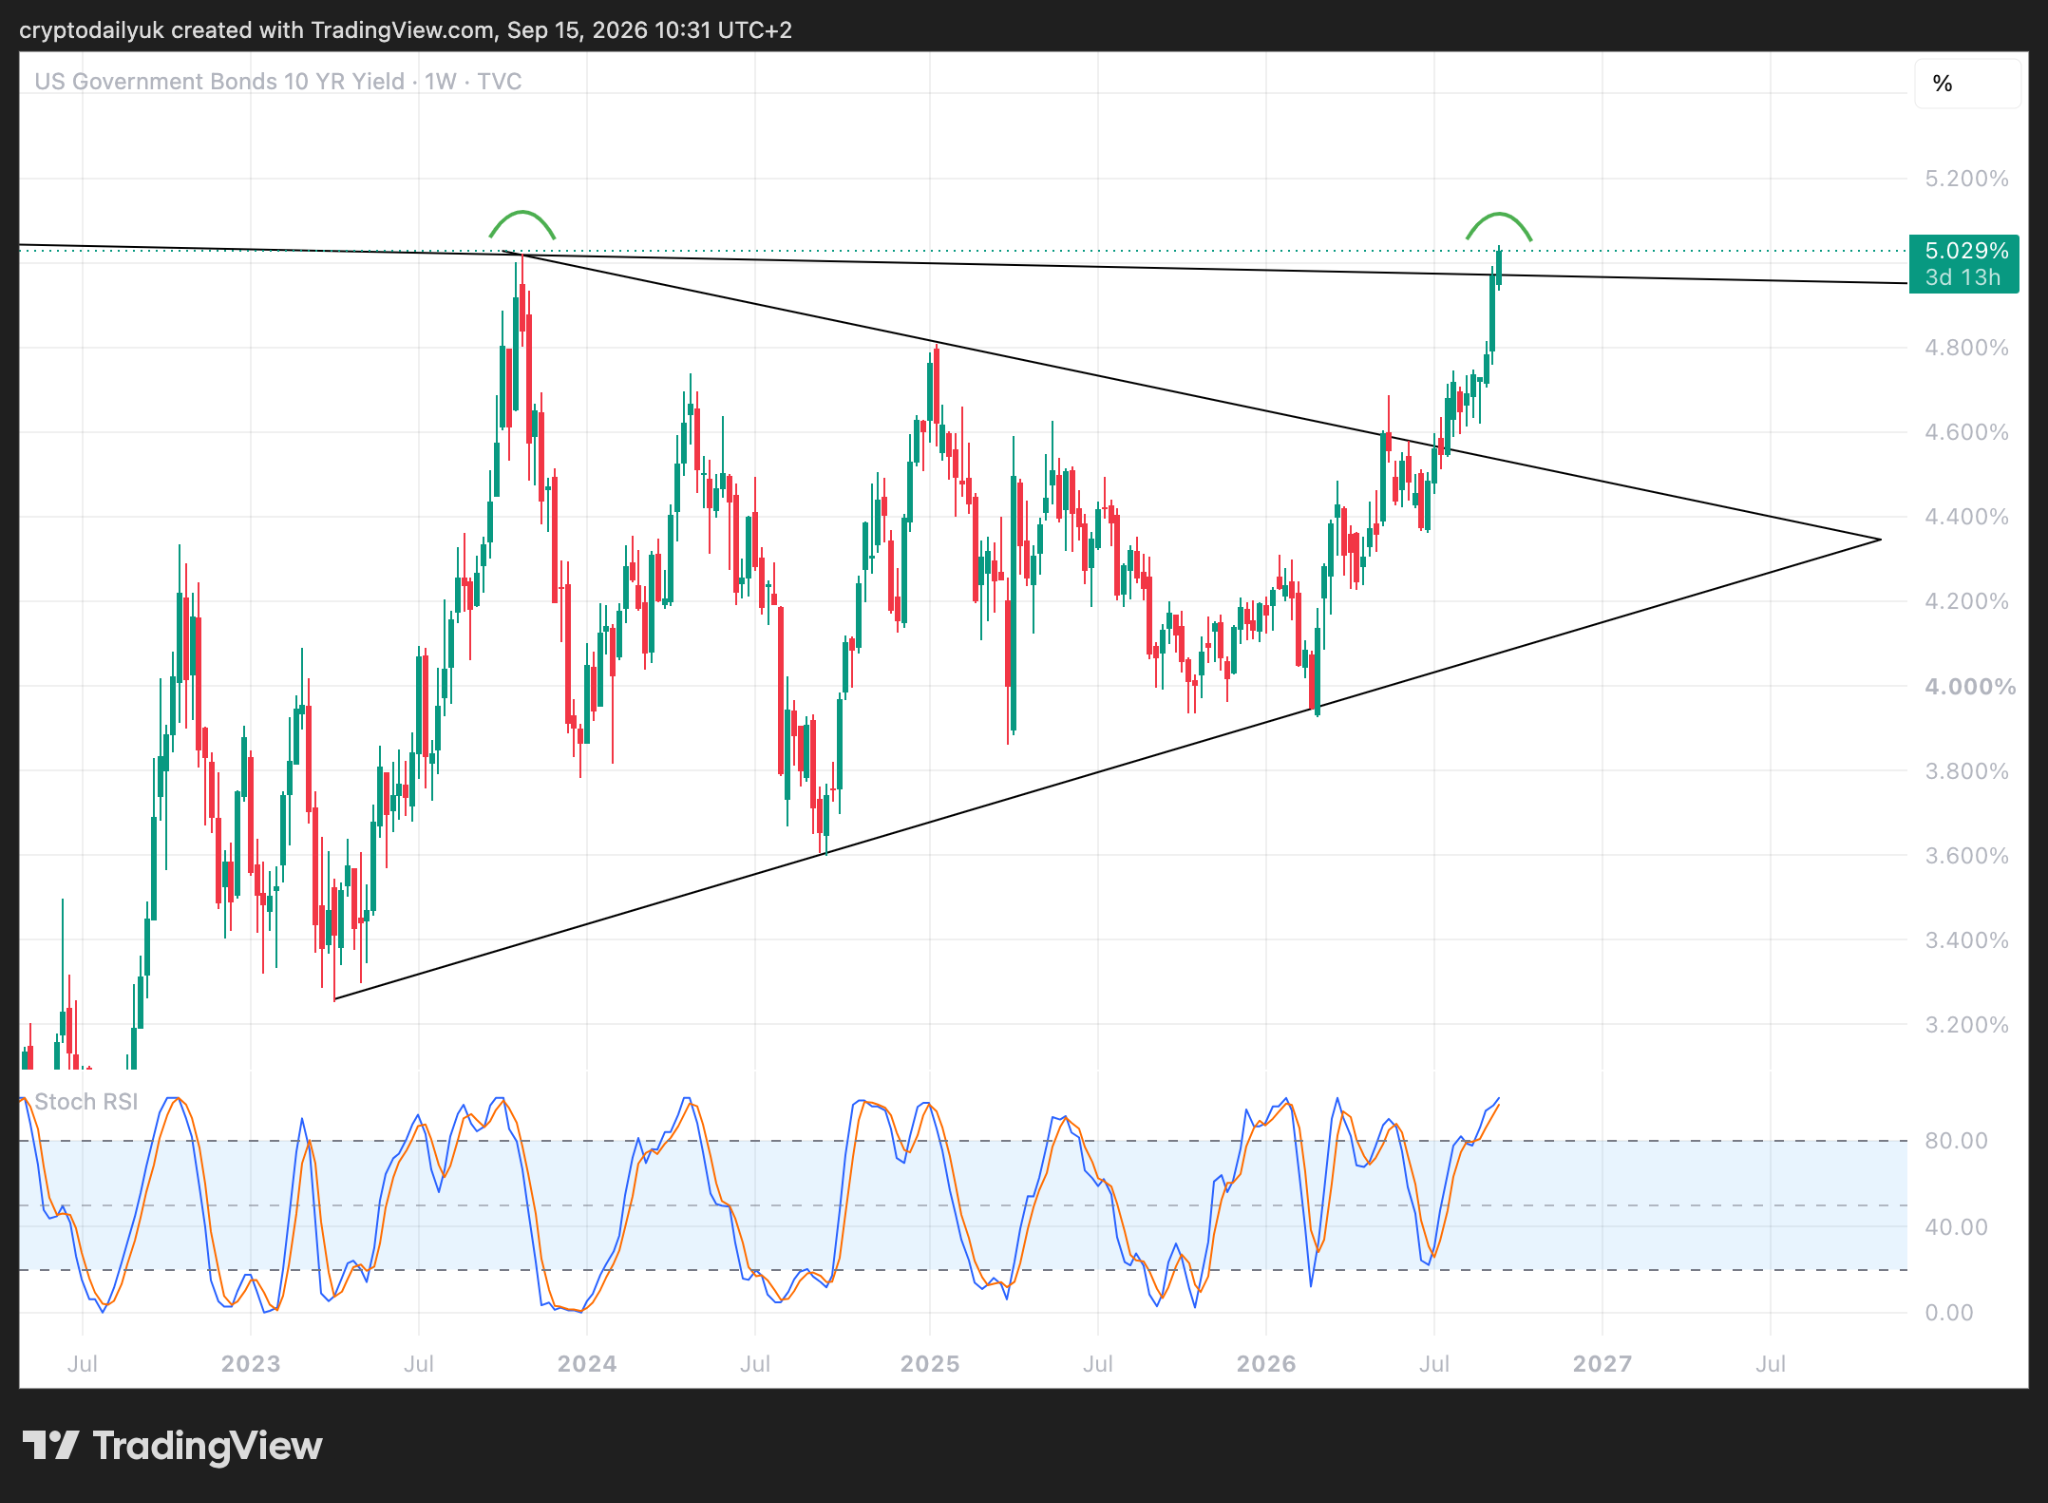
A surge in US government bond yields is tightening the screws on risk assets across the board, and Bitcoin is absorbing the pressure directly. The 10-year Treasury yield broke above 5% on Tuesday after punching through a descending trendline that stretches back to June 2007 – a 19-year ceiling that the market had never previously cleared on a weekly close. That breach has pulled Bitcoin down to the $76,000 support zone, a level that now carries serious weight for where the price goes next.
The connection between rising yields and Bitcoin’s decline is not incidental. Higher bond yields make risk-free government debt more attractive relative to speculative assets, drawing capital away from crypto and equities alike. With a 25 basis point rate hike from the FOMC widely expected at Wednesday’s meeting, the macro environment is applying layered downward pressure on BTC at exactly the moment its chart structure is weakening.

What the 10-Year Yield Chart Actually Shows
The weekly chart for the 10-year Treasury yield tells a story that bond traders have been watching closely. After escaping a wedge formation, the yield climbed steadily until it met that long-running trendline from 2007 on Monday. By Tuesday, it was above 5% – a level that triggers psychological and institutional alarm bells across financial markets.
There is a technical counterargument, though it comes with conditions. The yield has formed a double top at this elevated level, and the Stochastic RSI has reached its upper boundary – both readings that historically precede at least a temporary softening. If the yield does not break convincingly above that double top, bond markets may settle, removing at least one source of immediate pressure from Bitcoin.
That outcome, however, depends heavily on how the FOMC meeting lands Wednesday. A 25 basis point hike is priced in as near-certain by the futures market. The question is what language accompanies the decision – whether the Fed signals a pause or suggests further tightening is on the table. Either way, short and medium-term bearish pressure on Bitcoin is a reasonable expectation regardless of the yield chart’s technical condition.
The macro picture and the chart picture are not always the same story. Technical patterns suggest yield exhaustion; the policy calendar suggests continued stress. Bitcoin sits at the intersection of both.
Bitcoin’s Chart Is Running Out of Safety Nets
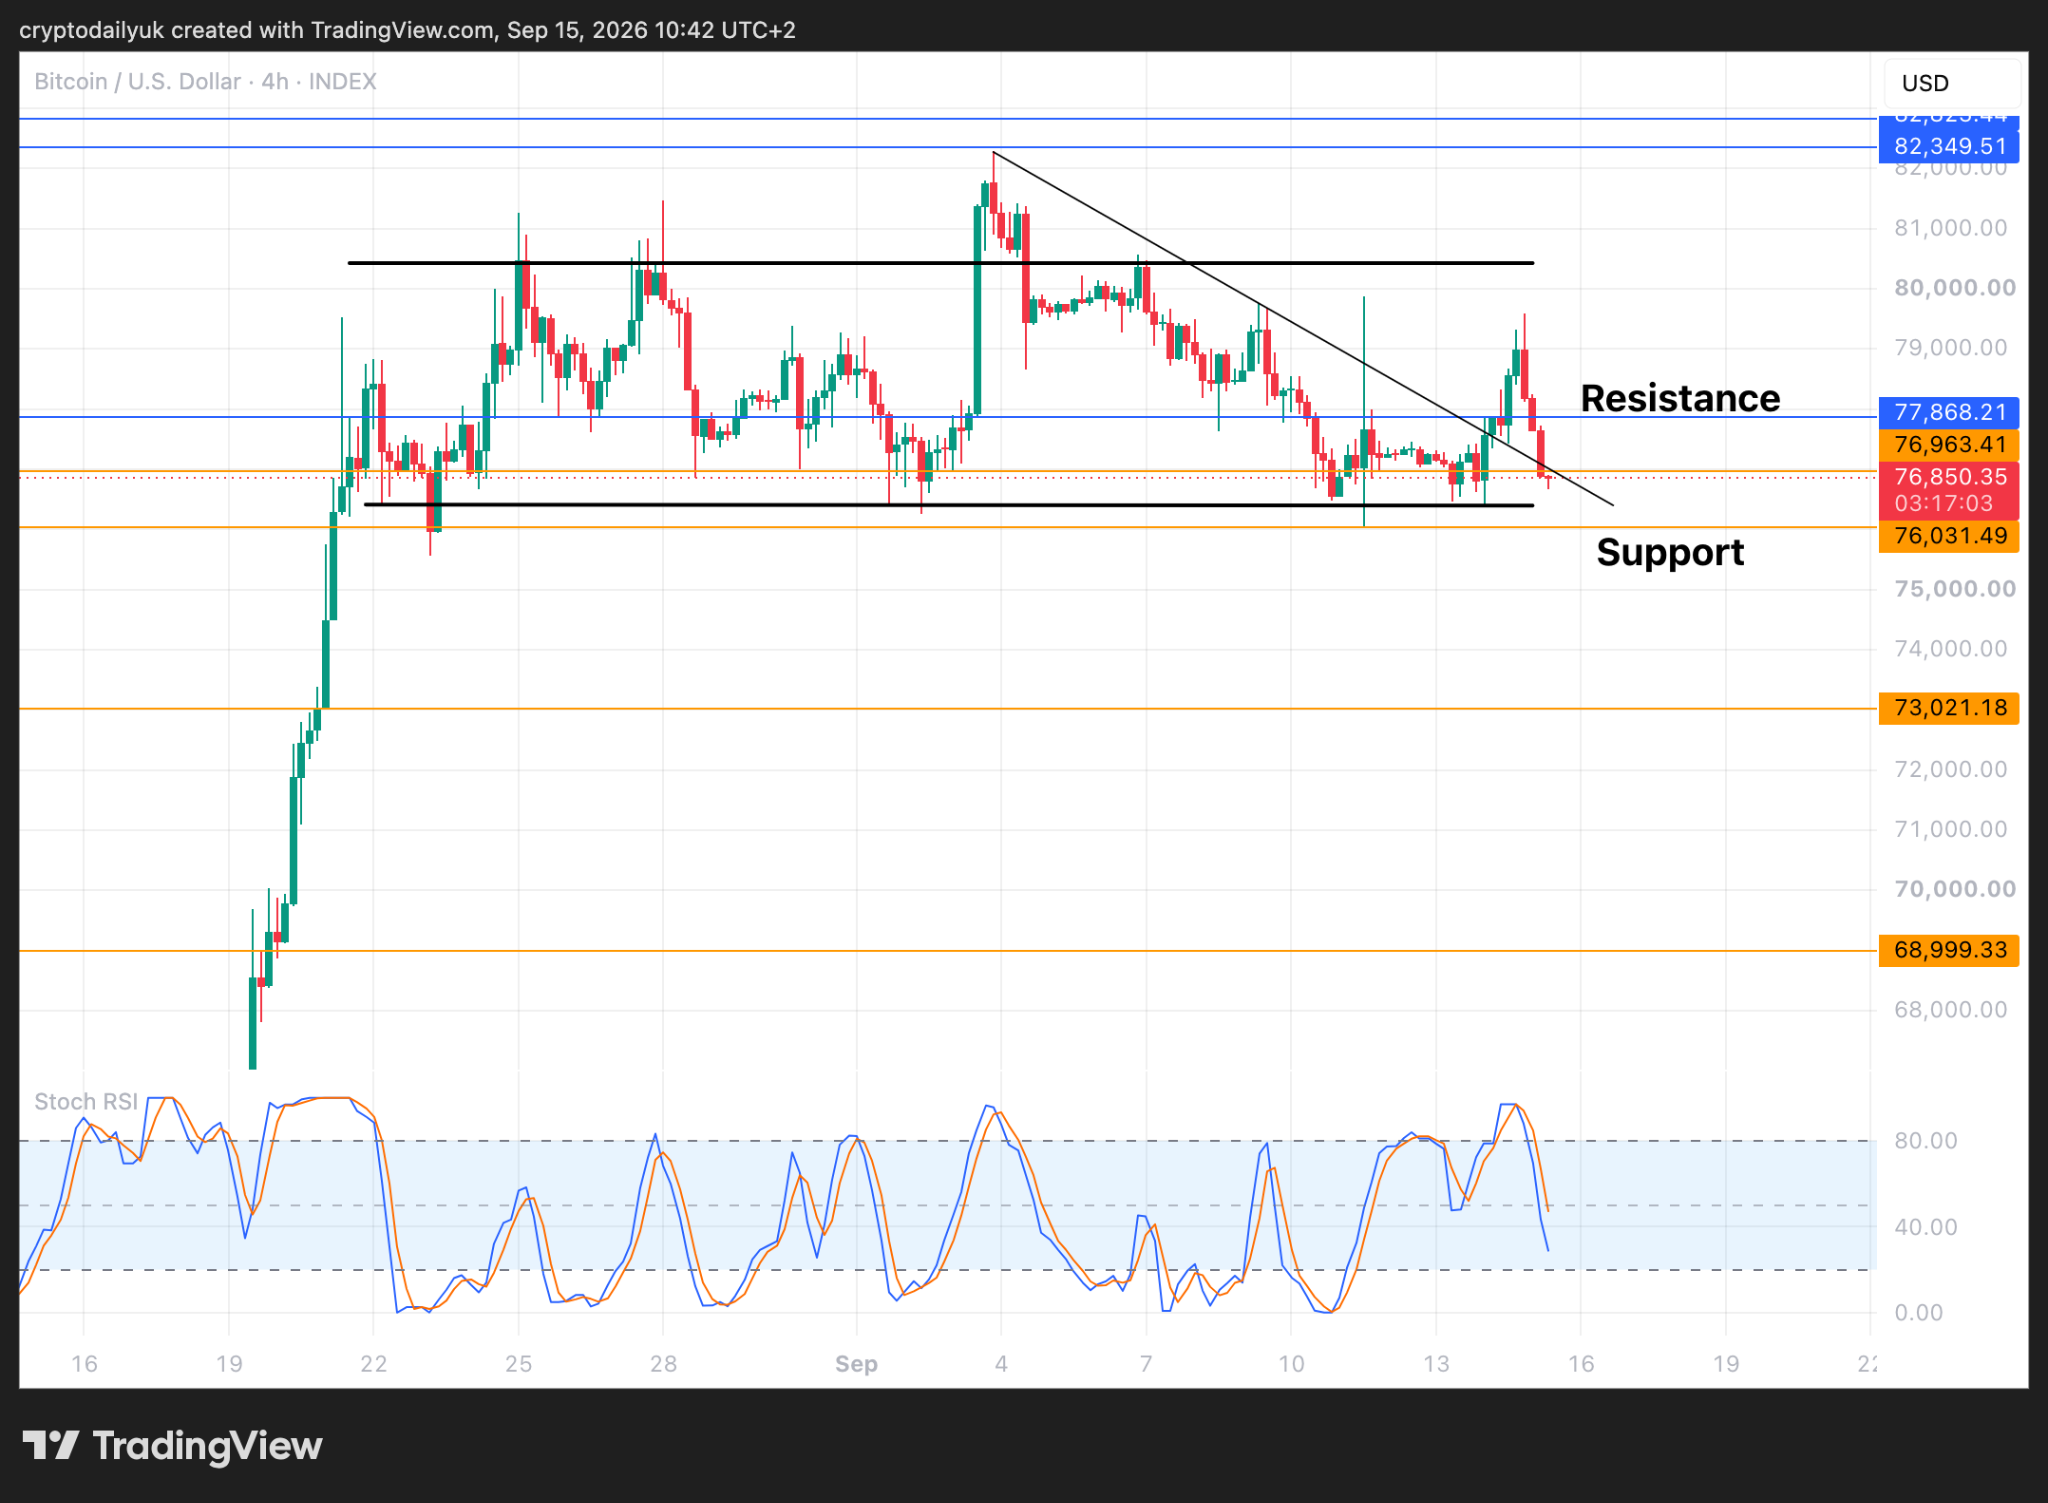
On the 4-hour timeframe, Bitcoin reached $79,600 before reversing – and that reversal matters structurally. The $79,600 print was a lower high, meaning the short-term trend is already making the sequence of lower highs and lower lows that defines a downtrend. Price has since fallen back below both the descending trendline and the $77,000 support level.
What remains between current price and a sharper leg down is thin. The bottom of Bitcoin’s parallel channel and horizontal support at $76,000 are the last meaningful barriers before a move toward $73,000 becomes the path of least resistance. Below that, the $69,000-$70,000 range has historically acted as a strong floor, but reaching it would represent a significant drawdown from the recent peak.
The daily chart adds another layer of concern: a head and shoulders pattern has been quietly forming, and the $79,600 bounce provided exactly the geometry needed for the right shoulder to complete. The pattern is not yet fully triggered – a breakdown through the neckline is required for the measured move to activate. That measured move, when drawn from the neckline downward, points almost precisely to where the 200-day simple moving average currently sits, giving the $69,000-$70,000 zone additional technical significance beyond just horizontal support. If Bitcoin breaks from the channel to the downside, that convergence of the head and shoulders target and the 200-day MA makes that zone the logical landing point.
A break below $76,000 without recovery would confirm the lower low, completing the downtrend sequence that started from the $79,600 rejection. At that point, the $74,967 territory that Bitcoin has already touched during recent macro stress events would come back into play quickly.
The Weekly Chart Still Holds a Bullish Thread – Barely
Step back to the weekly timeframe and the picture is not uniformly bleak. The flag formation that developed on top of Bitcoin’s large breakout candle has turned into a prolonged battle between buyers and sellers. It is not a textbook bull flag – a true bull flag tilts downward, signaling controlled consolidation before continuation. This one does not tilt, which weakens the bullish read. Still, as long as the channel holds without a breakdown, the setup gradually edges toward the bulls simply through the passage of time and consolidation.
The weekly RSI adds a meaningful data point. The indicator line broke above a descending trendline that had been in place for 2.5 years – a move that, if confirmed as new support, would support the case for a larger bullish continuation. The MACD on the weekly chart shows the blue line and red signal line still pointing upward, though the green histogram bars are shrinking, suggesting momentum is fading even if direction has not yet reversed.
Bulls need the RSI trendline to hold as support on a retest. Bears need $76,000 to give way. Both are waiting on a Wednesday Fed decision and a bond market that just did something it had not done in nearly two decades – and neither side yet knows which signal the market will decide matters more.
Comments are closed, but trackbacks and pingbacks are open.